Saturday, November 15, 2008
Lab 10
This was my favorite lab so far - not only because it was our last but also because I felt like I learned some new techniques and tried them here; like the neat line drop shadow and some other things. This is a bivariate map showing two sets of data on one map.

Monday, November 10, 2008
Lab 9
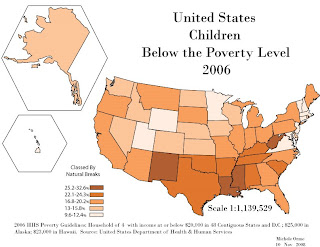
 This is a color version of Lab 7. The color versions, both hard and soft copy, display better than the grey scale version from Lab 7. To contrast the hard and soft copies, the printed version shows greater color changes. Specifically the two darkest colors on the hard copy are contrast more than when posted in the blog. However the two lightest colors contrast more with eachother than in the digital version. The lightest color on the digital version almost appears white whereas it is more tan on the hard copy. The only difference I would make, now that I can see the hard copy, is I would make the lightest color a little darker so as to not appear so white when seen on the computer screen.
Saturday, November 1, 2008
Lab 8
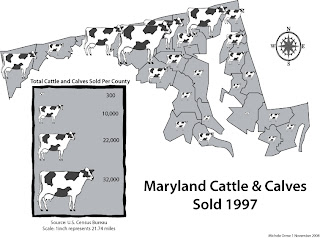
 This was a lab on proportional symbols. We pretended that the state of Maryland asked us to create a grey-scale map (we haven't had our color lesson yet) depicting the relative density of census data for each county. In a proportional symbol map, a symbol (cow) is scaled to various sizes to depict the relative magnitude of some value. Proportional symbol maps scale symbols to continuous sizes. Graduated symbol maps only scale symbols to discrete sizes.
Subscribe to:
Posts (Atom)


